

Fed raised rates for the first time since 2023 despite cooling core CPI. 10-year Treasury yields meanwhile jumped above 5%. Investors need to stop asking the simple question “Will the Fed hike again?” What inflation signal is the market pricing and how sensitive is your portfolio to higher real yields?
The five numbers to know first
- The Fed raised its target range by 25 basis points to 3.75%–4.00% on September 16.
- August headline CPI was 3.4%, while core CPI was only 2.4%.
- July headline PCE was 3.7%, core PCE was 3.3%, but the Dallas Fed trimmed mean PCE was just 2.3%.
- The 10-year Treasury yield rose from about 5.01% on the Fed decision day to 5.17% on September 25.
- The 10-year real TIPS yield rose from about 2.68% to 2.83% over the same span.
Why this Fed hike is more interesting than it looks
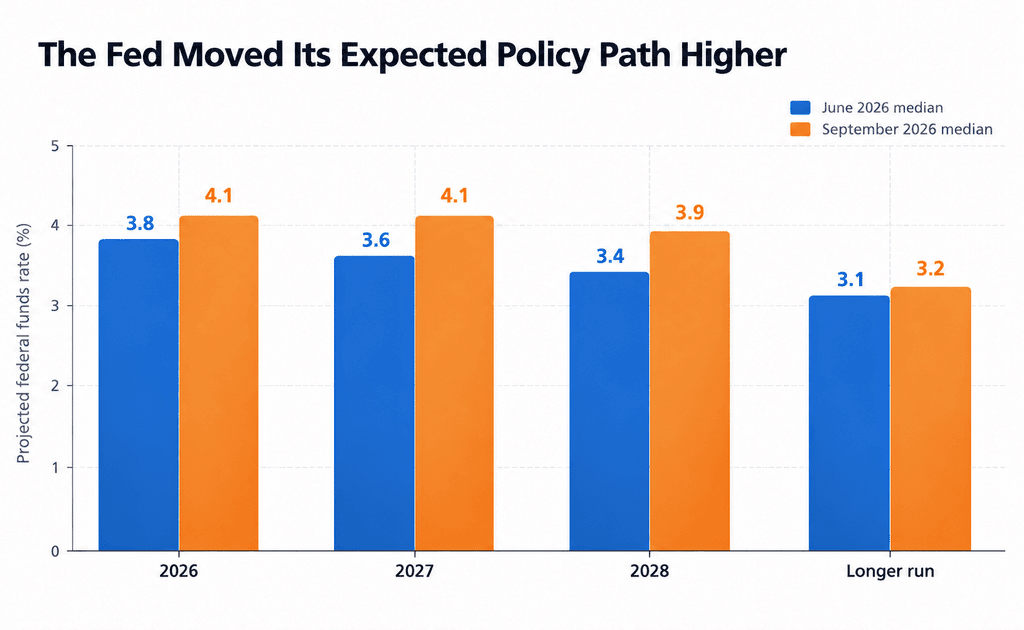
The Federal Open Market Committee on September 16 voted unanimously to increase the target range for the federal funds rate by a quarter point to 3.75%–4.00%1. The Fed’s statement said inflation remained elevated and the move was intended to support a return to the Fed’s 2% goal. The hike itself was modest, but the Fed’s updated projections were a bigger signal: The median policymaker now sees the federal funds rate finishing 2026 at 4.1%, up from 3.8% in June2.
That matters because markets discount the path of rates, not just one meeting. One 0.25 point hike is tiny. If you think borrowing costs will be higher for longer, that changes the discount rate on stocks, the yield people demand on bonds, the cost of mortgages, refinancing by companies and the return you can get on cash.
The real puzzle: inflation is telling five different stories
The beginner’s mistake is to think inflation is one number. It isn’t. Different measures address different questions.
Headline CPI covers everything consumers purchase and is close to the inflation people experience in everyday life. August’s 3.4% YoY gain was helped by a 16.3% increase in the energy index3. Core CPI, which strips out food and energy, was much cooler at 2.4%. CPI also matters beyond financial markets because it feeds into real-world cost-of-living decisions, including the 2026 Social Security COLA and other inflation-linked household adjustments.
The Fed closely follows the PCE price index, which includes a wider range of consumer spending and changes weights as spending patterns change. Headline PCE came in at 3.7% and core PCE at 3.3% in the latest reading for July4. But the Dallas Fed’s trimmed-mean PCE, which excludes the most extreme price changes rather than fixed categories, was just 2.3%5.
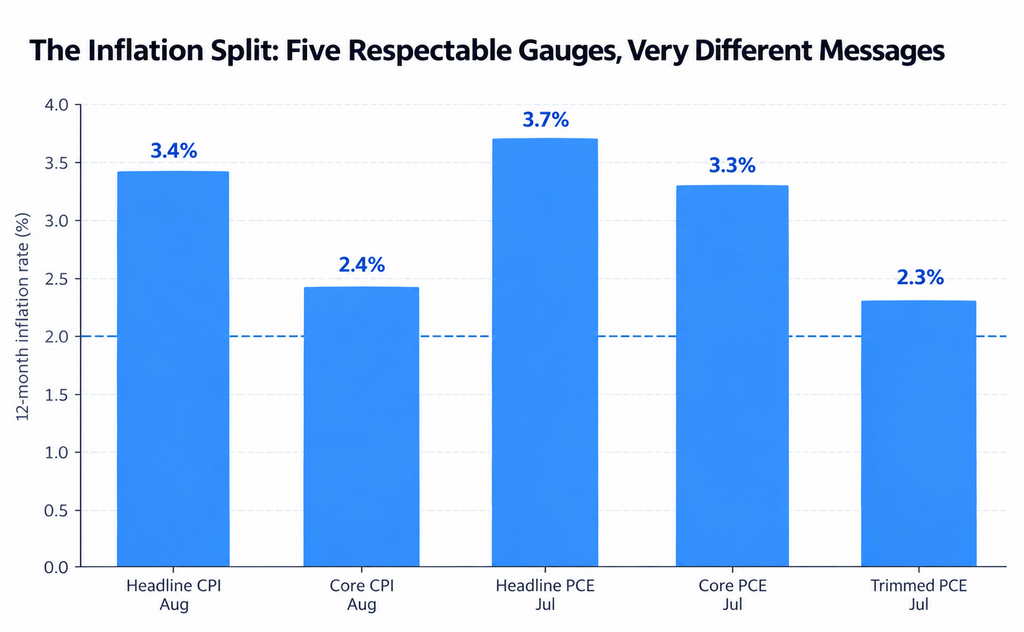
The main point of the article is this: The Fed is tightening policy in a world where “underlying inflation” is very much a function of how you measure it. Headline inflation suggests that price pressure is still uncomfortable. Core CPI says much of the current problem is concentrated outside the core basket. Core PCE says core inflation is still sticky. Trimmed-mean PCE says middle of price distribution a lot closer to target.
None of those measures is necessarily “the right one.” Energy shocks can distort headline inflation, but households still have to pay energy bills. Core measures can omit an important part of the cost-of-living experience. Trimmed measures can reduce noise but when inflation spreads in an unusual way, the trimming rule can fall behind reality. The difference between the measures should make investors less confident about making one-way bets on the next Fed move.
The bond market is sending a harder message than the Fed’s 25-basis point hike
The fed funds rate is not the best market signal right now. It is the level of longer term Treasury yields, and especially real yields.
As of September 25, the U.S. Treasury curve was at about 4.50% for one year, 4.81% for two years, 4.98% for five years, 5.17% for ten years and 5.49% for thirty years6. That means investors can earn about 5% in parts of the Treasury market without taking on corporate credit or equity risk.
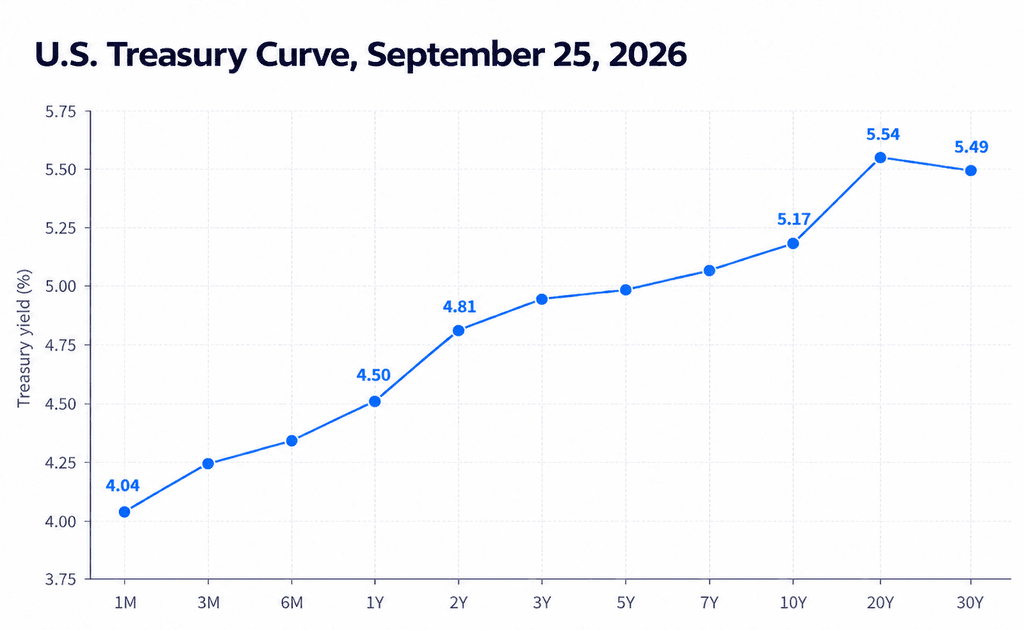
That’s a turning point for all other assets. If a safe Treasury is paying around 5%, a stock at a very high valuation has to justify why its future earnings are worth a much richer price. A highly leveraged property investment has to generate sufficient income growth to make up for more costly financing. So a 3% dividend stock isn’t necessarily interesting just because it pays a dividend.
More significant is the move in real yields. The 10-year real TIPS yield climbed from roughly 2.68% on Sept. 16 to 2.83% on Sept. 25. Real yields are yields after expected inflation is taken out. When they rise, the hurdle for taking risk rises as well. Long-duration assets, whose value is tied to cash flows far in the future, tend to feel that pressure the most acutely.
A useful mental model.
the Fed controls a very short-term policy rate. The market controls the discount rate that matters for many long-term assets. When 10-year nominal and real yields rise after a Fed hike, investors should pay attention to the bond market’s message rather than focusing only on the headline decision.
What actually happened on hike day
The September 16 response was telling. The S&P 500 fell about 0.45%, the Dow fell about 1.21% and the Nasdaq was basically flat. On that day, the two-year Treasury yield jumped, the dollar climbed, gold fell and Brent crude dropped7.
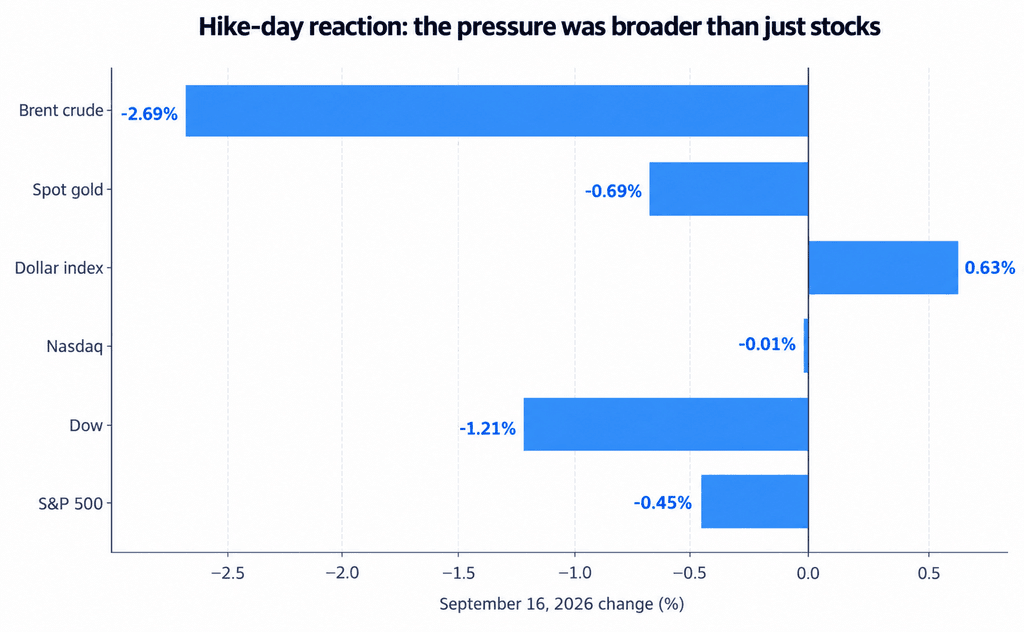
It would be a mistake to read too much into one session and conclude that technology is now “rate proof.” The Nasdaq’s resilience can be attributed to the cash-heavy balance sheets and strong earnings of its biggest companies, but the more speculative end of technology can still be very sensitive to real yields. It’s not just a tech vs non tech distinction. It’s profitable, cash generating growth versus distant, uncertain growth. And headlines, positioning and retail investor sentiment can also exaggerate short term reactions, so one volatile trading day should not be taken as a reliable long term signal.
A simple way to see why higher yields hurt long duration assets
| Approx. duration | If yields rise 0.25% | If yields rise 0.50% | If yields rise 1.00% |
| 2 years | -0.5% | -1.0% | -2.0% |
| 5 years | -1.25% | -2.5% | -5.0% |
| 8 years | -2.0% | -4.0% | -8.0% |
| 13 years | -3.25% | -6.5% | -13.0% |
There isn’t a quoted “duration” for stocks in the same simple manner, but the intuition carries through. A mature company with a large cash flow today has more of the value in near term cash flows. A young business whose value depends on profits far in the future behaves more like an asset of long duration. Those far-off profits are discounted more aggressively at higher real yields.
What this means for cash, bonds and stocks
Cash: no longer dead money, but still not a long term growth strategy
Cash equivalents are more competitive now than they were in the zero rate era, with short term Treasury yields around 4%-4.5%. This is important for emergency funds, short-term spending needs or money sitting around for a planned investment. For those just starting to build their financial foundation, learning the basics of budgeting for beginners might also be a good first step so that emergency savings and investable cash are clearly separated. Series I savings bonds are issued from May through October 2026 and offer a 4.26% composite rate8. But they come with eligibility, holding period and redemption rules and are relevant mostly to eligible U.S. investors.
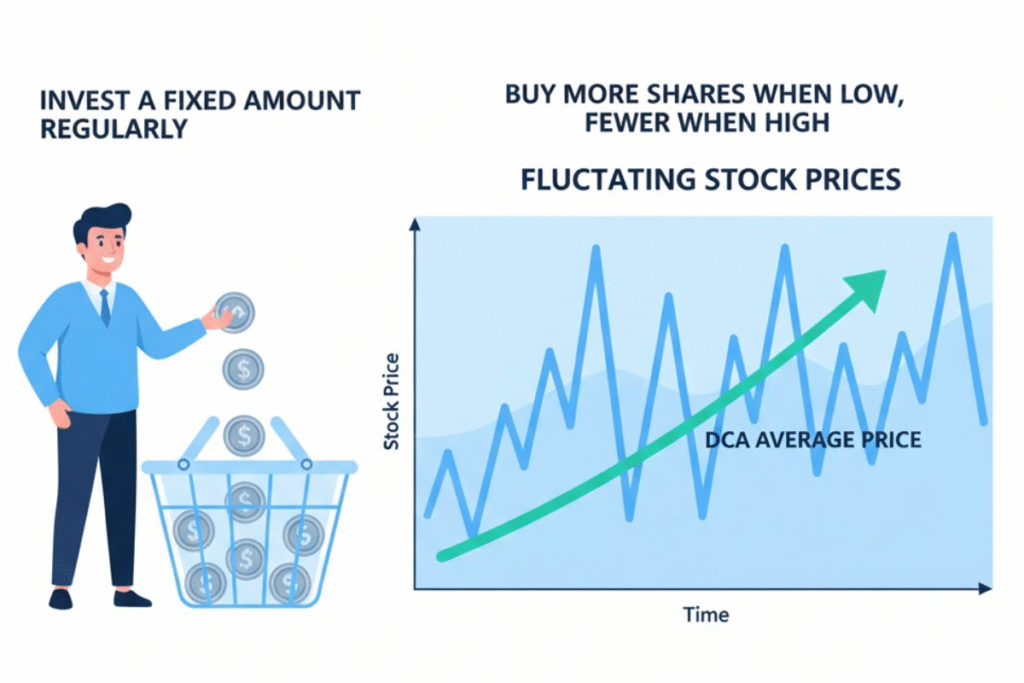
The pitfall lies in believing that because yields on cash are attractive today, cash will outperform diversified risk assets over a long horizon. Cash doesn’t substitute for long term investing. Cash preserves optionality. Dollar cost averaging is a systematic way for investors who are hesitant to try to time the market entry during rate induced volatility to invest periodically without needing to time the perfect Fed pivot or the market bottom.
Bonds: higher yields improve future income, but duration determines the ride
A lot more income for new bond investors than investors got a few years ago. But current long dated bonds can still fall in price if yields move higher. As a beginner investor, look at a bond fund’s duration, not just its yield. If you need the money soon, shorter duration reduces interest rate sensitivity. If you have a long time horizon and can handle volatility, longer bonds may ultimately deliver more upside if yields fall subsequently, but that’s a separate bet on interest rates.
Stocks: quality of cash flow matters more than a sector label
Higher rates put pressure on valuations, but not every company is affected the same way. A useful checklist might be: Does the company generate free cash flow already? Does it require frequent refinance? Is it fixed or floating rate debt? Can it increase prices without killing demand? Is it priced on today’s earnings or a far off growth story?
That framework is especially important for AI and technology investment. A profitable platform company with net cash and rapidly growing earnings is a universe away from an unprofitable “AI story” that needs capital markets to fund a few more years of losses. Both might be in the same technology bucket but their rate sensitivity might be completely different. For readers researching the space, comparing this macro backdrop to specific AI stocks in 2026 will show how company fundamentals interact with higher real yields.
REITs and dividend stocks: compare income with the new risk-free alternative
That’s a more difficult comparison for income assets when Treasury yields are around 5%. A 4% dividend yield is attractive with earnings and dividend growth, but the yield is not enough on its own. Investors should consider the expected total return, balance sheet risk and growth rate in conjunction with that of government bonds.
What history says and what it cannot tell you
Charles Schwab looked at 18 episodes of tightening after World War II and found that, on average, the S&P 500 fell about 12% from its peak within six months of the first hike and about 14% within a year, as of a September 2026 review9. Speed of tightening mattered: Faster cycles had deeper average drawdowns than slower ones.
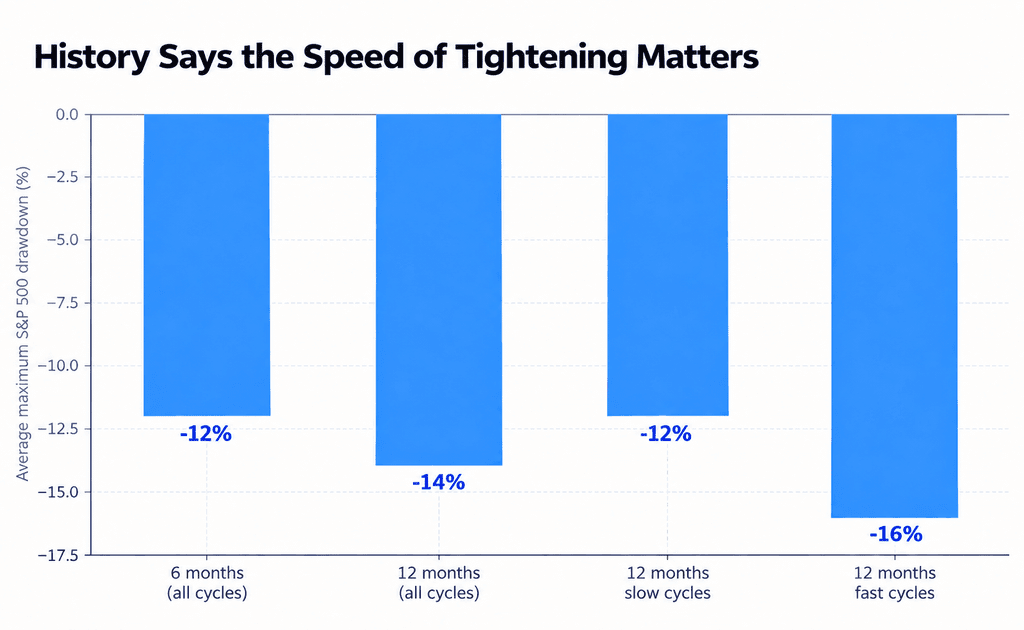
That’s good background, not a trading tip. The environment today is one of unusual energy pressures, high Treasury issuance, strong technology capital spending and an inflation picture where core and headline measures are diverging. Fiscal uncertainty can add yet another layer of volatility as well. Investors looking for more background can review how a government shutdown can impact markets. The first hike is often volatile, history tells us. It doesn’t tell us whether this cycle will be fast or slow, or just one or two hikes before policy turns around again.
The three-dial dashboard I would watch instead of trying to predict the Fed
1
Inflation breadth
Is inflation spreading across many categories, or is the headline being driven mainly by energy and a few volatile components?
2
10-year real yield
If real yields keep rising, long-duration bonds and expensive growth stocks face a tougher valuation hurdle.
3
Earnings & refinancing
Can companies grow profits fast enough to offset higher discount rates and higher borrowing costs?
This dashboard is more useful than trying to guess the precise next policy move. Growth valuations get a breather from a narrowing of inflation breadth and a decline in real yields. But if inflation broadens and real yields continue to climb, investors should prepare for a tougher valuation environment. Strong companies can still do well even with high rates if earnings continue to surprise positively.
Next dates that matter:
BEA is scheduled to release August PCE data on September 30, 2026. BLS is scheduled to release September CPI on October 14, 2026. The next FOMC meeting is October 27–28, 2026.
A practical portfolio checklist for beginner to intermediate investors
You do not need to rebuild your portfolio because of one Fed meeting. A better response is to audit where your risk actually comes from:
- Emergency cash: check whether it is earning a competitive short-term yield.
- Bond funds: find the duration. If you do not know it, you do not fully know the interest-rate risk you own.
- Growth stocks: separate profitable companies from businesses whose value depends on distant future profits.
- Dividend and REIT holdings: compare their expected total return with a Treasury market offering around 5% at longer maturities.
- Debt: variable-rate consumer or business debt becomes more expensive when rates stay high; reducing expensive debt can sometimes offer a clearer “return” than reaching for more portfolio risk.
- Diversification: avoid making the entire portfolio a bet on one inflation forecast or one Fed meeting.
Bottom line.
The September rate hike is not the most important number. The more consequential development is that inflation gauges disagree while nominal and real Treasury yields are high enough to compete seriously with risky assets. For investors, that makes cash-flow quality, duration and valuation more important than trying to guess the next Fed headline.
- Federalreserve.gov : https://www.federalreserve.gov/newsevents/pressreleases/monetary20260916a.htm ↩︎
- Federalreserve.gov :https://www.federalreserve.gov/monetarypolicy/fomcprojtabl20260916.htm ↩︎
- Bls.gov : https://www.bls.gov/news.release/archives/cpi_09112026.htm ↩︎
- Bea.gov : https://www.bea.gov/news/2026/personal-income-and-outlays-july-2026 ↩︎
- Dallasfed.org : https://www.dallasfed.org/research/pce ↩︎
- Treasury.gov : https://home.treasury.gov/resource-center/data-chart-center/interest-rates ↩︎
- Reuters.com : https://www.reuters.com/world/china/global-markets-wrapup-1-2026-09-16/ ↩︎
- Treasurydirect.gov : https://www.treasurydirect.gov/savings-bonds/i-bonds/i-bonds-interest-rates/ ↩︎
- Schwab.com : https://www.schwab.com/learn/story/take-hike-rate-hikes-and-market-impacts ↩︎


Pingback: Forget the AI Bubble Debate. Follow the $730 Billion Money Trail. - Blog | by Dhan Invests